Power BI’s email subscription vs PowerBI Robots: what are the differences?

When it launched in March of 2018, PowerBI Robots introduced many features Power BI users had been asking for years, like the ability to schedule and recurrently send reports by email, to a SharePoint library or display them on a large TV screen. Since then, Microsoft gradually added these features to Power BI in one way or another, but the way scheduling, report content or the slideshow are handled couldn’t be more different.

We broke down the main differences between Power BI’s email subscription service and PowerBI Robots in the following table, but keep reading for a deeper look at each of them:

Microsoft Power BI

PowerBI Robots

Sends a preview image of a report or dashboard and a link to access it on Power BI Online Sends various reports as high-definition images, on a single PDF or multiple PDFs
Sends only 1 report page per subscription Sends unlimited report pages per subscription
Sends reports to email addresses Sends reports to email addresses, SharePoint folders, filesystems or to a URL
Sends reports to anyone in your organization Sends reports to anyone, even if outside your organization
Sends reports once a day, once a day after data refresh, or once a week Sends reports whenever you want, from once every 10 minutes to only once a year
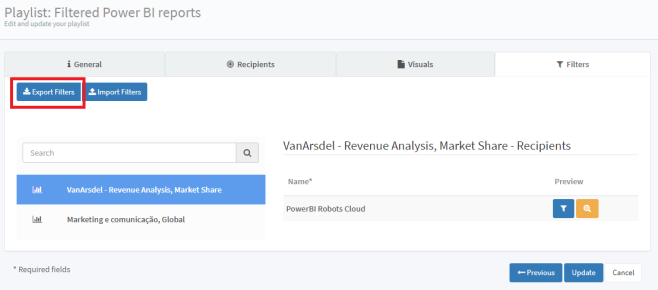
Link to the reports don’t keep applied filters Reports are sent with applied filters
Doesn’t allow any filtering customization Sends different filtered reports to different users
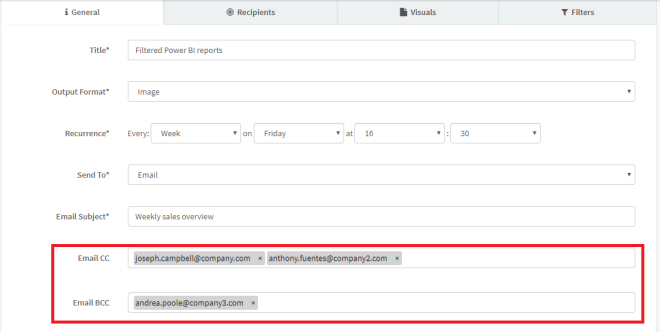
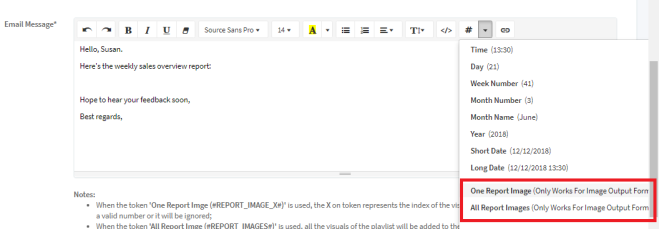
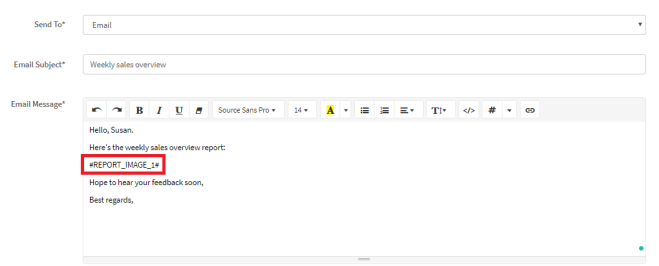
No email body customization Full email body customization
Slideshow mode with no data refresh Slideshow mode with data refresh
Scheduling:

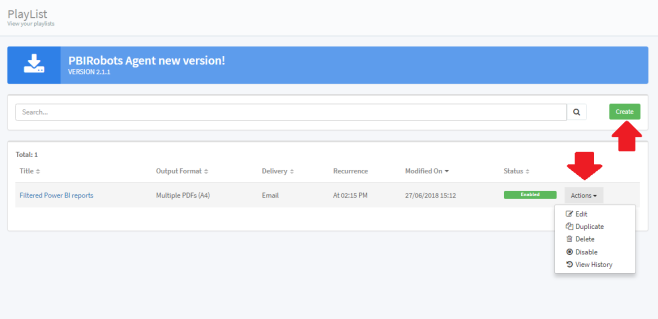
Setting a recurrence for report delivery was the main driver behind PowerBI Robots’ development, as clients were begging for a method to update people who didn’t use Power BI but had to take a look at the data in the reports. PowerBI Robots recurrence can be set for a large variety of intervals, ranging from once every 10 minutes to once a year. Soon, it will support other forms of recurrence, such as specific days of the week.

This type of recurrence is already supported by Power BI’s scheduling system, but it severely limited to 3 options: once a day, once a day after data refresh and once a week. This means that if you need to inform someone more than once a day or only once a month, you can’t do it using Power BI alone.

Power BI subscription pane
Power BI allows you to schedule reports for specific days of the week, a feature that will soon be available in PowerBI Robots
Supported formats:

Email is the only delivery method supported by Power BI and sending reports by email is limited to users from your organization, as Power BI will prevent you from adding any “outsiders” to your subscription’s mailing list.

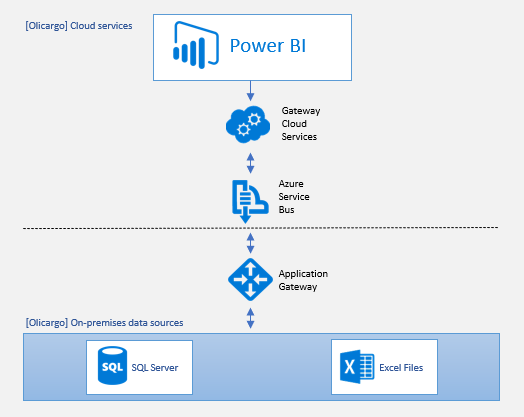
Email is by far the preferred delivery method among PowerBI Robots users, although the solution supports additional delivery methods that can make a difference in some organizations. Sending reports to a SharePoint or Filesystem folder comes in hand when you want to share information with a large pool of individuals, and soon you’ll be able to keep a record of these reports in the form of screenshots or PDF files, a new feature geared towards auditing scenarios. PowerBI Robots also allows companies to share reports and dashboards with emails outside their organization, one of the most common scenarios among its users, as covered in our SPAR and Olicargo case studies. The body of emails in PowerBI Robots is also fully customizable and includes tokens for the most common fields.

Content:

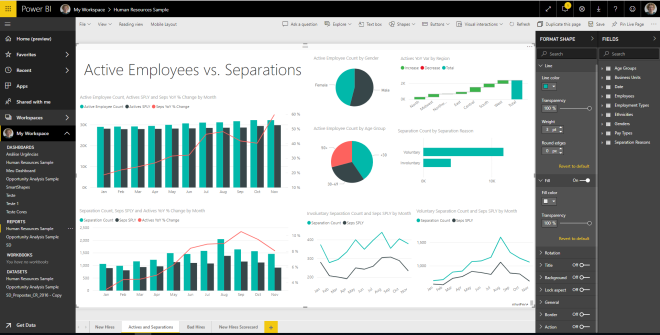
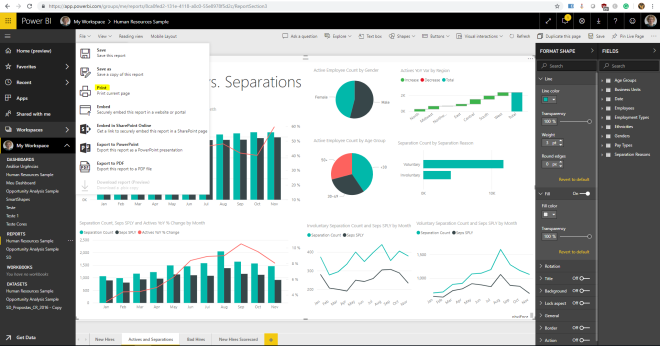
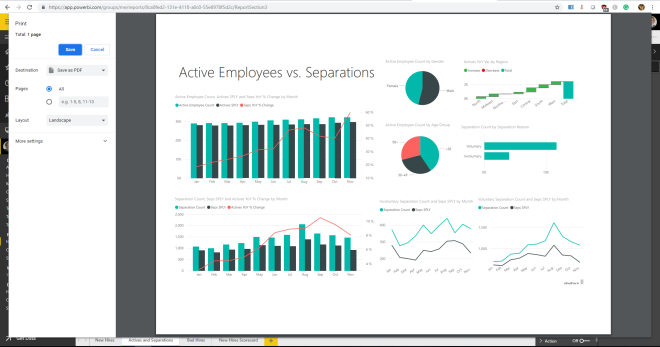
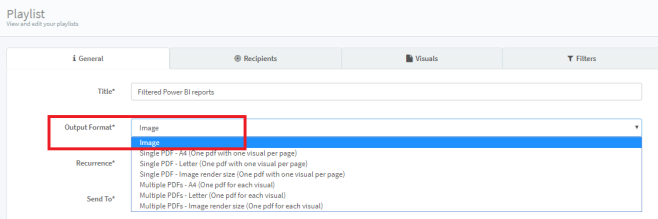
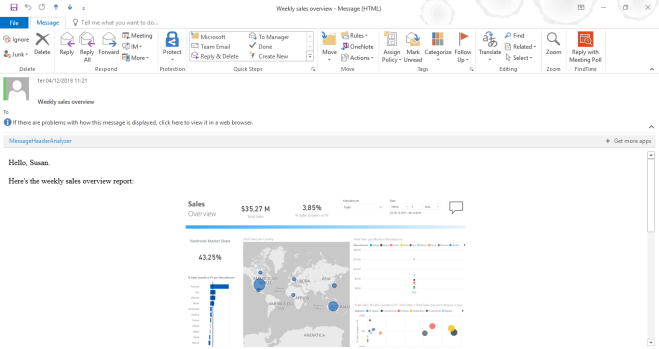
Content is where Power BI’s subscription service and Robots’ differ the most. When you send a report via email through Power BI, users receive a preview picture (PNG) accompanied by a link to navigate the report on Power BI Online. In contrast, PowerBI Robots sends reports as high-definition static pictures (either embedded or as attachments if you choose email as your delivery method) or single or multiple PDF files, not allowing users to access and navigate the full report on Power Online.

Power BI is severely limited to a single dashboard or report page per subscription, whereas PowerBI Robots works with a playlist method that supports as many report pages per subscription as you wish. This allows you to set up a single subscription with multiple report pages, the exact opposite of what you would have to do on Power BI – where you would need multiple subscriptions with single report pages to achieve the same effect.
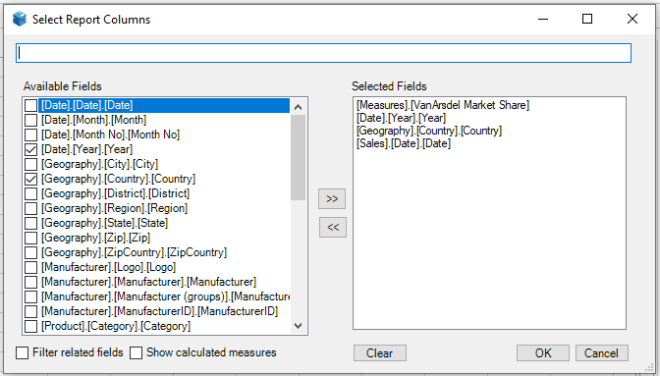
Filtering:

Scheduling through Power BI doesn’t allow for any filtering since what you’re sharing is access to your whole report. By clicking the link and accessing the report on Power BI Online, users can apply any filters of their choice, so there’s no point doing it before setting up the scheduling.

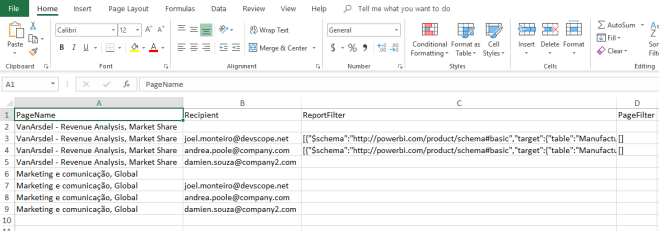
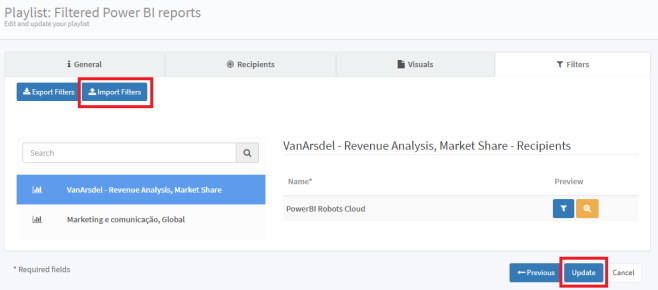
Since PowerBI Robots’ purpose is wholly different – sending high-quality images of reports -, users are free to set up any filtering of their choice. Static images remove interaction and access to all information from reports, but sometimes that’s exactly what users may want. In the SPAR case we mentioned before, we had a chain of over 100 stores that shared a common Power BI central dataset. Because each had its own administration, reports had to be filtered to ensure they didn’t have access to data from other stores. PowerBI Robots allows you to apply different layers of filtering: at a global level, and individual filters per user, allowing you to send different data to different people, from the same report.

PowerBI Robots filters
PowerBI Robots lets you set up filters for each individual recipient
Slideshow:

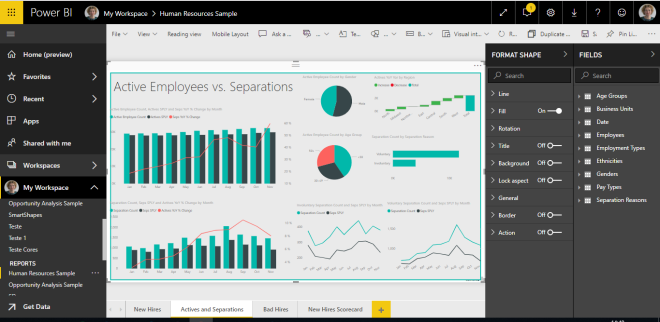
During March’s update, Microsoft introduced a slideshow feature in the Power BI Windows app, a feature that lets you present a report and rotate between its pages automatically, based on a pre-set frequency between 5 and 30 seconds. The slideshow is part of Power BI’s presentation mode, which is supported on any device running Windows, be it a Surface Hub, a desktop or a tablet.

PowerBI Robot’s slideshow feature works a bit differently, since it doesn’t run directly from Power BI, but the cloud. PowerBI Robots generates a unique URL for your playlist that you can paste on any browser to start a slideshow. The frequency between slides starts at 10 seconds and goes up to 5 minutes. Unlike Power BI’s slideshow, Robots doesn’t allow you to pause your presentation, but, on the other hand, it always displays a report’s most recent data, something Power BI alone doesn’t do.

Olicargo team using PowerBI Robots
Among other things, Olicargo uses PowerBI Robots to spread operational KPIs around the office.

If you have any questions or need help using PowerBI Robots, please check the product’s 101 guide or contact us by email.

Send Emails, PDFs or broadcast from Power BI with PowerBI Robots

PowerBI SmartPivot 101: everything you need to get started

PowerBI SmartPivot is our first product for 2019, and we couldn’t be more excited about it. Much like the rest of our PowerBI Tiles family, PowerBI SmartPivot was born as an answer to our clients’ problems prior to being spun into a mass market product. In this case, our clients worked mainly in the retail sector and made extensive use of Excel PivotTables in their daily activity. Their woes included a high dependency on IT staff to connect databases to Excel, the lack of granularity provided by Excel alone and, perhaps most importantly, the time it took to filter their PivotTables when analyzing a wide range of items, a common occurrence in retail.

What is PowerBI SmartPivot and who is it for?

PowerBI SmartPivot is an Excel add-in aimed at professionals who regularly work with PivotTables. PowerBI SmartPivot introduces several features that make their life easier, namely the abilities to connect OLAP data cubes and Power BI to Excel, scan all data in an analytical model, apply filters in bulk instead individually ticking a PivotTable’s checkboxes and create granular table reports with ease.

Downloading and installing

An annual PowerBI SmartPivot license is available at DevScope’s store from 99.99€, but you can try it for free by downloading a full-featured 30-day trial version.

If you purchase a license during the product’s launch window, you can use code POWERBI-SMARTPIVOT-30 at checkout for a 30% discount.

After downloading PowerBI SmartPivot, extract the file and double click it to run the installation wizard. Follow the steps and click finish. Open Excel and you should see a grayed out SMARTPIVOT tab.

PowerBI SmartPivot 101
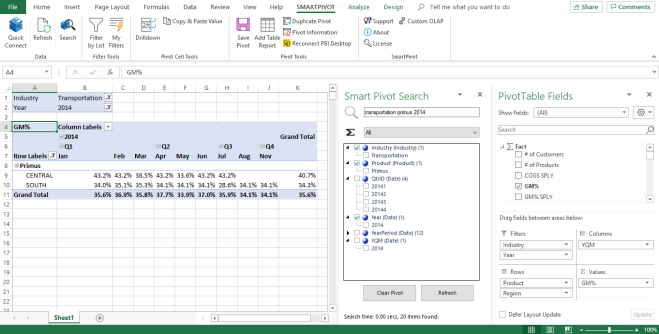
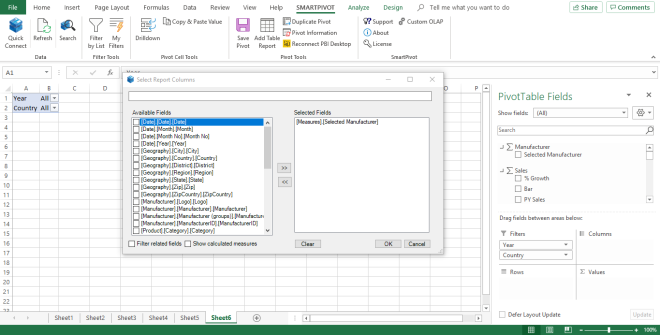
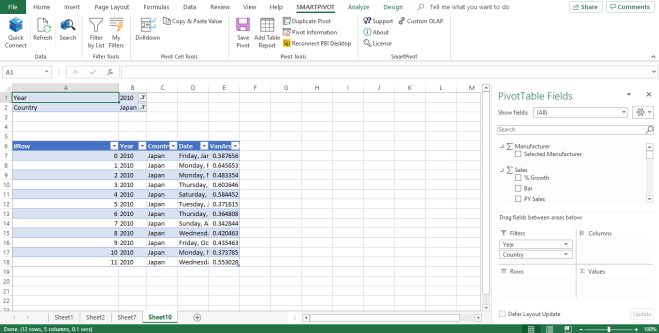
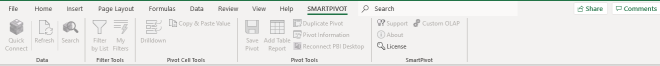
Click the License button and introduce the key emailed to the address you used to register for the PowerBI SmartPivot trial. Once validated, all options will become available.

PoweBI SmartPivot 101NOTE: if you don’t see the SMARTPIVOT tab in Excel, go to File > Options and click the Add-ins tab.

PoweBI SmartPivot 101
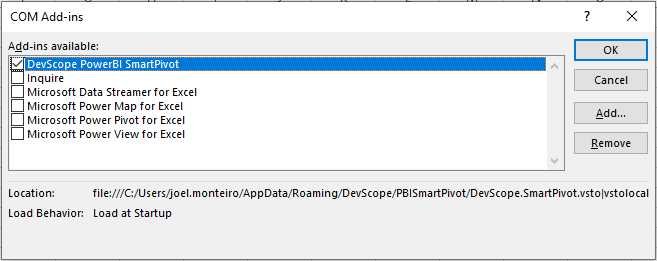
From the Manage dropdown menu, select COM Add-ins and click the Go button. Make sure the DevScope PowerBI SmarPivot check-box is ticked and click OK.4aPoweBI SmartPivot 101a

The SMARTPIVOT tab should now be visible. If you still can’t see it, please email our support team.

Connecting OLAP cubes and Power BI to Excel

In order to connect a Power BI dataset to Excel, you must first open it in Power BI Desktop. Once you do, go to the SMARTPIVOT tab in Excel and click QuickConnect. You should see it in the list of connections available.

5

Double-click it and confirm the range. The PivotTable Fields will appear in the panel on the right. Select which fields you want to add to your PivotTable or drag them to the preset areas below.

6

Using the search function

PowerBI SmartPivot’s search function greatly expands on what Excel can do by itself, allowing users to find exactly what they’re looking for, regardless of the complexity of their analytical model.

To use it, select any cell in your PivotTable and click the search icon in the menu. A new pane will open next to the PivotTable Fields selection.

7

You can place any queries in the search field to find exactly the data you’re looking for. In the example below, we’ll ask PowerBI SmartPivot for the gross margin percentage (GM%) of transportation of Primus in 2014. PowerBI SmartPivot will instantly scan your data model and present you a list of the fields that best match your query.

8

Check the boxes from the list to add that data to a new PivotTable.

Filtering a PivotTable by a list of values

The more data you have in an analytical model, the harder it is to find exactly what you want. Even when you know where to look, it may take some time picking the values for your PivotTable because Excel only allows you to select or deselect all values at the same time.

PoweBI SmartPivot 101

This isn’t really a problem when you’re working with a small PivotTable, but individually picking which values to filter is a major annoyance when you’re working with hundreds or thousands of items. This annoyance became apparent to us when working with some of our retail clients. Their PivotTables often had hundreds or thousands of different products in them, which meant spending many minutes checking boxes one by one. Earlier last year, we launched Filter by List for Power BI itself on Microsoft’s AppSource for free and now integrated it in Excel with PowerBI SmartPivot.

Using it couldn’t be simpler. With at least a cell of your PivotTable selected, click the Filter by List icon from the menu to open the Pivot Filter pane. Write or paste a list of values you wish to filter your list by and click Apply Filter.

10

Your PivotTable will change and reflect those values.

11

NOTE: If your PivotTable has more than one hierarchy, make sure you select the correct one from the dropdown list.

PoweBI SmartPivot 101

If you plan on using the same filter recurrently, it’s a good idea to save it. To do so hit the Save Filter button after applying it. PowerBI SmartPivot will save the values in your filter and direct you to a Saved Filters pane, where you can apply, update or delete previously saved filters.

13

To access your saved filters, select any cell on the PivotTable and click the My Filters button from the menu to open a pane with the list of saved filters.

14

Creating a granular table from an OLAP cube

The final PowerBI SmartPivot feature we’ll cover in this guide is the ability to quickly create a granular table report by selecting its fields from a list. To do so, select a cell containing one of the results in your PivotTable and click Add Table Report from the menu. A window containing all possible fields will open.

15

To create a table, pick a field from the Available Fields and add it to the Selected Fields section.

PoweBI SmartPivot 101

When you’re done, click ok to create your table instantly in a new Excel sheet.

PoweBI SmartPivot 101

Thank you for your using PowerBI SmartPivot and making it through this (extensive) 101. PowerBI SmartPivot includes a few other features we won’t cover in this 101 because we feel are self-explanatory, but if you need any help using them, let us know.

If you still have any questions regarding PowerBI SmartPivot, please check the product’s FAQs or contact us by email.

PowerBI SmartPivot

Introducing PowerBI SmartPivot. Try it today for free!

We’re proud to announce PowerBI SmartPivot, a Microsoft Excel add-in that introduces several new features aimed at boosting the productivity of advanced PivotTable users.

PowerBI SmartPivot introduces a few features to answer the many woes we were seeing among PivotTable users, both in clients and within DevScope:

QuickConnect – instantly connect Excel to Power BI Desktop and Online, as well as Online Analytical Processing (OLAP) data cubes. All connections are saved automatically, so users only need to hit refresh the next time they open Excel to have their data at hand;

Search – find exactly what you want regardless of how complex your PivotTables are. PowerBI SmartPivot‘s search engine greatly expands what Excel can handle, allowing you to insert queries and instantly search all data content on an analytical model for an answer. All values found this way can be added to any location of your choice;

Filter by List – apply filter values to a report in bulk instead of individually checking each box in the filter pane, a feature previously only available to Power BI users. With PowerBI SmartPivot, all you need to do is paste a list of values in the slicer visual to filter by exactly what you wish. Filters can be saved and used later;

Table Reports – create highly detailed table reports using an easy to use search and pick method. Search for any fields in an analytical model and create a granular table report with them in just a few seconds;

Despite its name, you don’t need Power BI to use PowerBI SmartPivot, although the ability to connect the former to Excel is one of its main selling points. If PivotTables are part of your everyday life, we are sure PowerBI SmartPivot will make it much easier.

An annual license of PowerBI SmartPivot is available from 99.99€, but you can try it for 30 days for free without any limitations.

If you order PowerBI SmartPivot during its launch window, use the following code at checkout for a 30% discount:

POWERBI-SMARTPIVOT-30

PowerBI SmartPivot

PowerBI Robots version 2.1.11’s new features: here’s how to use them

PowerBI Robots just turned 1 year old, and we’re celebrating with a new version that introduces a couple of much-requested features:

  • Add Cc and Bcc addresses when sending reports by email – let supervisors know which reports are being sent by PowerBI Robots;
  • Edit filters in bulk using an Excel file – save time by downloading our template and editing filters in bulk using Excel;

To start using these new features, you must update your PowerBI Robots client to the latest 2.1.11 version. Click here to download it.

Add Cc and Bcc addresses when sending reports by email

If you need to keep managers or supervisions in the loop about any reports sent by email, you can add their email addresses to the newly introduced Cc and Bcc fields in the General tab after selecting Email in the Send to field.

Cc and Bcc fields PowerBI Robots
You can find the newly added Cc and Bcc fields when sending to an email

Whenever you send a report via email to any of your recipients, every address on the Cc and Bcc fields will also receive a copy in their inbox. If you apply different filters to different recipients of the same report, addresses on the Cc and Bcc fields will receive all filtered versions of that report.

Edit filters in bulk using an Excel file

The second feature introduced in version 2.1.11 allows users to save time by editing filters in bulk in an Excel file and uploading it to the PowerBI Robots web client. This feature was designed with experienced users in mind due to the risk of misediting important information, so be warned before venturing here.

To edit filters in bulk, go to the Filters tab and click Export Filters to download an Excel file named after your playlist.

2
Click Export Filters to download an Excel file

After opening this file, you’ll notice four fully editable columns:

  • PageName – write the path to any report page in this column. Page names are very specific, so we highly advise that you have at least one instance of the page you want to send and use copy/paste for new recipients;
  • Recipient – add the email of any recipients to this column;
  • ReportFilter – edit report-level filters in this column by changing any of the contained values;
  • PageFilter – edit page-level filters in this column by changing any of the contained values;
You're free to edit each column in Excel
You’re free to edit each column in Excel

After editing your Excel file, return to the Filters tab in PowerBI Robots’ online agent, and click the Import Filters button. Click Create or Update to finish.

Import the Excel file to apply your filters

If you still have any question, are running into some issues after installing PowerBI Robots version 2.1.11 or have some suggestions for future releases, please email us at support@devscope.net. Your feedback is greatly appreciated.PowerBI Tiles Pro

Workaround for PowerBI Robots and Power BI’s printing issue

For the past two weeks, Power BI has been undergoing some adjustments that have created an issue affecting its export to PDF and print functions, as well as our solution PowerBI Robots.

The result is a cut off in a report’s upper left corner when printing or sending it via PowerBI Robots, as displayed below:

Power BI report
Intended Power BI report in its entirety
Cropped upper left corner
Cropped upper left corner after encountering the issue

Several users have contacted us regarding the issue and written numerous posts on the official Power BI forums, as well as others since this also affects Power BI’s native print and export to PDF functions.

We’ve been in contact with Microsoft since we first encountered this issue and have confirmation that it will be fixed in all regions by Friday, April 5th.

Until it’s fixed, we have a workaround that you can find below:

  • Open Power BI and select the reports that appear cut-off in the “Print PDF” option and/or in PowerBI Robots;
  • Click “Edit Report” and select the “Shapes” in the top toolbar;
  • Insert a rectangle around the whole visual;

Power BI issue 1

  • In the “Format Shape” right-hand panel, set “Line” and “Fill” to 100% transparency (the rectangle will be invisible, therefore not affecting or changing the existing visual);

Power BI issue 2

  • To test this solution, use the “Print” option and validate if the visual appears correctly in the page preview;

Power BI issue 3

Power BI issue 4

DevScope’s team truly apologizes for any inconvenience this may have been causing to the daily functioning of your company.

If you still have any issues with PowerBI Robots, please send us an email to support@devscope.net.

PowerBI Tiles Pro

How Power BI shaped Olicargo’s global operation

The larger the company, the harder it is to assure everyone is working with the same information.
The Client:

Olicargo is a transport and logistics company with branches in Portugal, Angola, Mozambique, and China, and represented by an international network of over 4.000 offices all over the world. Starting as a modest family business in the late 1980s, Olicargo remained so until 2012 when the newly formed SGM Logistics Group acquired the company and gave it a massive boost. With the introduction of capital, know-how and the “Always moving ahead” philosophy, Olicargo saw its €3M/year business grow to €40M and the small team of 8 employees in Porto and Lisbon jump to a staff of about 250 scattered all over the globe.

The problem:

Olicargo’s international expansion faced a few challenges, chief among them the ability to centralize, access and control information. Much like the company itself, Olicargo‘s data was spread across several countries and systems. Offices worked separately and sent Excel files back and forth between them, a clear sign that the company needed Business Intelligence. After witnessing the work with Power BI DevScope did for Contidis, – an Olicargo partner since day 1 – decision-makers got in touch with our BI team and told us about their need for reliable, readily available information.

The solution:

The Olicargo project started in late 2017, when Ruben Cunha, BI Developer at DevScope, worked on a two-week Proof of Concept (POC) based on data from Excel files relating to cargo handling processes. Olicargo immediately took notice of what Power BI could do for their business and hired Ruben to work with their control and management staff and implement it on site during the following year.

“In two weeks, Power BI gave us what took us months or even years to do. One of DevScope’s advantages is the ability to show results in a short amount of time. It was a display of capacity and potential.”

– Paulo Salgado, CEO at Olicargo

DevScope started by tackling the commercial and operational areas, giving Olicargo a clear vision over their expenses, budgets, sales and margins, processing and customer portfolio. The results were great, and Olicargo decided to expand Power BI to its remaining business areas during the following months, and create detailed Business Intelligence reports for finance, treasury, marketing management, human resources, procurement, warehouse cargo, and fleet management.

Olicargo's Power BI solution architecture
Olicargo’s Power BI solution architecture

Stating that Power BI profoundly altered Olicargo is no understatement. During the process of gathering data to feed these reports, the company took the opportunity to reorganize itself and rethinking many of its internal and external operations.


This slideshow requires JavaScript.

Part of DevScope‘s approach when implementing a solution is assuring the client becomes as autonomous as possible using it, so 5 Olicargo staff members were mentored by our team in Power BI solution. It didn’t take them long to become proficient enough to create their reports and dashboards. More importantly, they now fully understand Microsoft’s platform’s capabilities and are identifying new opportunities to add to the company’s reports.

Olicargo Power BI
Olicargo’s staff creates their own reports and identifies new opportunities in Power BI.

Olicargo was also one of DevScope’s first clients to take full advantage of PowerBI Robots, our in-house developed solution that allows users to automate the delivery of Power BI reports and dashboards. Olicargo uses PowerBI Robots internally – to display business indicators in the smart TV’s spread around the company’s HQ –  but, most notably, externally, to regularly and automatically send clients reports of their activity with Olicargo by email. These are not special custom made reports but extracted directly from Olicargo‘s own Power BI, taking full advantage of PowerBI Robots‘ filtering abilities to only show clients the information they need.

Olicargo team using PowerBI Robots
Among other things, Olicargo uses PowerBI Robots to spread operational KPIs around the office.
Results:

A little over a year after the project’s kick-off, Power BI has become an integral part of the daily life at Olicargo. The company’s entire operation effectively transitioned to Microsoft‘s platform, and Key Performance Indicators are automatically and continually shared with everyone at Olicargo, be it at the gorgeous container ship-shaped headquarters in northern Portugal or the office in China.

Power BI processes information on a daily basis and sharing Excel files became a thing of the past. So did the many requests between the different areas at Olicargo – everyone is now on the same page and feeding off the same source of information. Gone are the days of sending emails asking how much the company is billing, how much they’re carrying or how many tons of air cargo they’re doing.

Decisions are more educated than ever and backed by the most recent data at hand.

“We broke with the past. Power BI sort of revolutionized the company’s strategic management. It’s now based on Power BI and the information it gives us. I rarely resort to Excel files, and when I do, they’re always connected to Power BI. The whole company is.”

– Paulo Salgado, CEO at Olicargo

What we did:
  • Translated Olicargo’s several business areas to Power BI by creating full-fledged, granular reports of each of them;
  • Mentored Olicargo’s employees in Power BI, effectively making them proficient in the platform;
  • Fully automated internal and external Power BI reports with PowerBI Robots;
Products used:

Do you want to learn more about DevScope’s solutions? Contact us.
Are you a DevScope client and would like to have your case study featured here? Get in touch.

Send Emails, PDFs or broadcast from Power BI with PowerBI Robots

We’re getting ready for Building the Future. Take a peek.

We’re a week away from the inaugural edition of Building the Future, an Ativar Portugal event powered by Microsoft, that will give attendees a chance to see and experience the technology that will shape everyone’s daily lives in the near future and hopes to be the largest tech showcase in Portugal.

Taking place on the 29th and 30th of January, in the sumptuous Pavilhão Carlos Lopes, in Lisbon, Building the Future‘s main feature will be the aptly named “Intelligent Day” area where companies will demo and display the tech they’re working on with the goal of making everyone’s lives easier. Attendees will have the chance to partake in themed tours, and as one of the event’s sponsors, DevScope will be part of the “Empower People” tour. Our main draw will be SmartDocumentor Expenses, an AI & Machine Learning solution that will rid employees of tedious and time-consuming paper expenses and save companies a tremendous amount of time and money in the process, by making expenses processing and reimbursement as automatic as possible.

Building the Future will also host many sessions featuring some of the visionaries behind the technology. Among them are our Business Intelligence Manager and Data Platform MVP Rui Romano 29th with the session “Modern BI with Microsoft Power BI” on the 29th, and our Data Researcher and AI&ML resident specialist Rui Quintino with “Lean Artificial Intelligence with Deep Learning and AutoML” on the 30th.

If you’re attending Building the Future, make sure you take the time to embark on the “Empower People” tour or attend one of DevScope’s speakers’ sessions to see some of the work we’re doing. You can also drop by our booth at the event and meet the team.

Tickets for Building the Future are still available. Get them here.

PowerBI Tiles Pro

Transdev unifies its many databases with SQL Server and Power BI

Without the proper setup, a diversity of systems means a huge headache to whoever needs to handle and analyze data. Fortunately, there is a remedy for that.
The client:

Transdev is a French-based public transport group operating in 20 countries. Transdev is a worldwide leader in subway and railway transportation, and one of the major players in bus transportation, employing 82.000 people and with a revenue of over €6.6 billion. Present in Portugal since 1997, Transdev is one of the largest bus and coach operators in the country, with a fleet of over 1.500 vehicles.

The problem:

Transdev’s Portuguese operation grew through a series of mergers and acquisitions but felt some inevitable growing pains. In order to extract reports, the company had to monitor some indicators, such as ticketing and fleet consumption, but faced a huge obstacle: with each assimilated operation using their own set of systems and databases, Transdev had no easy way to connect and cross the amount of information on their hands. The company needed to unify all data from these many different operations and have it working towards the decision-making process.

Transdev launched Citi Express in 2011
The solution:

Transdev’s relationship with DevScope dates back to 2010 when Rui Romano developed an HTML5 reporting platform that allowed employees to analyze and comment on some indicators that still live on their current Business Intelligence solution. When Transdev contacted him again, asking for a way to unify all their different operations, he was well aware of the company’s current situation. The project seemed challenging and presented another perfect opportunity to put Rui Romano’s “Start Small and Grow Big” work methodology to good use. In practice, it means implementing a solution in an Agile way with short and fast stages, modifying it to answer any of the clients’ problems and scale it according to their needs. Since this allows for a tailored approach, clients only need to implement solutions according to their business needs.

Stage #1 – Unifying different systems through a Data Warehouse

Nuno Miguel Silva, José Barbosa, and Bruno Ferreira, BI consultants at DevScope, designed a Data Warehouse – nicknamed Prometheus – that would feed on over a dozen of Transdev’s Ticketing (Datacar, Wayfarer, and Card4B) and Operation (ABC) databases.

Prometheus
Transdev’s ETL Framework

Due to the different nature of these systems, the DevScope team developed a fast and dynamic ETL Framework for Microsoft SQL Server Integration Services (SSIS), allowing for faster design and development of ETL solutions and making it easier to change configurations. Prometheus serves as an intermediary on the entire processing, receiving data from its original databases and transforming it to be used afterward.

Power-BI-Transdev-005

“The diversity of systems made the process a little bit more complicated. And, on top of that, we found that users would be using different methods, even when working on the same system. Because of that, we had to standardize processes.”

– Maria Gabriel, Application Manager and Data Scientist at Transdev

The Data Warehouse with DevScope’s ETL framework gave Transdev a central platform to extract, transform and load data. Whenever a new data source comes in, Transdev’s IT department has no trouble adding it to the data warehouse: all they need to do is configure a few metadata tables. The company also had to normalize the way their workers handled it. Prior to the introduction of Prometheus, Excel was Transdev’s tool of choice but individual edits to files made data management slow and figures unreliable. The entire decision-making process was compromised.

Stage #2 – Introducing Power BI

After regulating Transdev’s different systems through a data warehouse, the next step was to output such a large amount of information. Given its integration with SQL Server, Power BI was the logical choice for the task. Rui Romano is a well-known advocate of Power BI’s virtues and demoing it was enough for Transdev to realize how interactive reports and dashboards could dramatically change several areas of their operation. The company currently has 30 active Power BI Pro users and generates 10 different reports, ranging from ticketing to fleet consumption.


This slideshow requires JavaScript.

Prometheus is updated every day so Transdev technicians can always count on a fresh batch of trustworthy data in the morning when they arrive at the office. Real-time analytics is not necessary and because the entire process requires a lot of computing resources, updating outside working hours makes the process seamless.

Results:

Speed and information reliability were the first noticeable aspects of Transdev‘s data warehouse used in combination with Power BI. Understandably, some of Transdev’s methods of analysis completely changed to accommodate the new solution.

“Information is now more reliable, available, and has the granularity that allows us to make better decisions.”

– João Soares, Director of Purchases and IT at Transdev

Transdev’s platform is a work in progress and a testament to the “Start Small, Grow Big” approach. After working out the basics – the data warehouse and business analysis platform – the DevScope team keeps introducing new features according to the client’s needs. Just recently, we added the option to import CSV files to the warehouse.

Transdev hopes that the system becomes increasingly dynamic and able to quickly react to changes in ticket prices and promotions from competing companies. Their long-term goal for the platform is to have it dictate the business itself, i.e., use data to launch new products and support the company’s evolution.

autocarros_transdev_23

Transdev is a multinational group, present in 5 continents, and their technicians meet regularly to see what each team has been doing and exchange some learnings. After watching Transdev Portugal’s Power BI dashboard in action, other teams were very impressed and keen on adopting these solutions.

What we did:
  • Unified Transdev’s radically different databases through a data warehouse
  • Developed a fast and dynamic ETL framework for SQL Server Integration Services that quickly adapts to new changes and data sources
  • Gave Transdev a state-of-the-art reporting tool in the form of Power BI, delivering accurate and up-to-date information to make educated business decisions
Products used:

Do you want to learn more about DevScope’s solutions? Contact us.
Are you a DevScope client and would like to have your case study featured here? Get in touch.

How to embed Power BI reports in emails

Sending Power BI reports by email is one of the most used PowerBI Robots features and one that’s been available since its launch, back in March this year. Users have been able to send Power BI reports as an image or PDF attached to their email, but the most recent update to PowerBI Robots introduces a much-requested feature: the ability to embed those reports in the email’s body.

The whole process is very simple:

Log into the web agent, and either create a new playlist or edit an existing one.Screenshot (56)

On the General tab, select Image as the output format.Screenshot (57)

Scroll down to the Email Message, and edit it however you wish. With the cursor placed where you wish to embed a Power BI report, click the down arrow next to the pound (#) sign and either select All Report Images (to insert a token that embeds your entire playlist images in a row) or One Report Image (to embed just one image from your playlist).Screenshot (59)

If you select the last option, the token #REPORT_IMAGE_X# is inserted in your email body. Replace the X with the corresponding report number on your playlist (starting from 1) to embed it in your email.Screenshot (58)

Click Update, open the PowerBI Robots desktop agent to synchronize your playlists after these changes, and you’re done. Your playlist recipients will now be able to see the reports embedded in their emails.Screenshot (60)

If you have any questions or suggestions regarding PowerBI Robots, please leave a comment or send an email to powerbi@devscope.net.

If you haven’t registered for PowerBI Robots yet, you can do it here.Embed Power BI reports and dashboards in PowerPoint, Word and Outlook

PowerBI Robots version 2.1.1 is here with the features you requested

Client feedback is a crucial aspect of our development process, and we are always open to requests from those who use our products. Since its last big update, our product team received many requests to add features to PowerBI Robots that could address some problems felt by clients all over the world.

To those who contacted us with the hopes of seeing some of their issues addressed by PowerBI Robots, we are glad to announce that version 2.1.1 is now available for download.

Version 2.1.1 of PowerBI Robots includes the following new features:

  • Users can now choose to stop sending playlists whenever they encounter a timeout/error;
  • Images can now be embedded in emails instead of attached;
  • Improved PDF image quality – now exactly the same as when you export from Power BI;
  • New PDF size format available: US letter size;
  • Overall improved performance;

Click here to update to PowerBI Robots 2.1.1 now.

If you’re running into some issues after installing PowerBI Robots version 2.1.1 or would like to suggest more features for future releases, please email us at support@devscope.net. Your feedback is always welcome.

Embed Power BI reports and dashboards in PowerPoint, Word and Outlook