Follow us on our public website here: https://DevScope.net/insights

Join us at the Global DevOps Bootcamp 2019!
The Global DevOps Bootcamp is back, and we’ve partnered once again with the DevOps Porto community to host it at our office on June 15.
The Global DevOps Bootcamp is a free 1-day event held by local communities all over the world, organized by Xpirit and Solidify and all about DevOps on the Microsoft Stack. Attendees will have a chance to debate, learn and play with DevOps concepts with people from all continents who share their enthusiasm.
Titled “Your build it, you run away it”, this year’s Global DevOps Bootcamp is all about the “run” part of DevOps and will focus on the concept of Detect, Respond, Recover. These three phases will be dissected and applied to scenarios where you will learn to overcome challenges, build a solution, and run it as a DevOps team would. Because this means getting your hands dirty, you should come prepared with a laptop, a lot of curiosity, and a mindset to share your experiences and knowledge around Azure and DevOps practices with other attendees.
Below is the agenda for the Global DevOps Bootcamp 2019:
09:00 – Drop in, coffee
10:00 – Introduction
10:15 – Keynote
10:45 – Local Keynote
11:15 – Start Bootcamp
13:00 – Lunch
13:30 – Continue Bootcamp
16:00 – Demos
16:30 – Wrap-up
Last year’s Global DevOps Bootcamp was the second time the event was held, and the first time we hosted it in Portugal. Here are some of the highlights:
It took place in 77 different venues all over the world, and over 8.000 attendees participated in it, a tremendous increase from the 1.500 people who joined the inaugural event. We are hoping to break the record once again and would love for you to join us. To do so, please follow this link and register for free.
See you here on the 15th!


Power BI’s email subscription vs PowerBI Robots: what are the differences?
When it launched in March of 2018, PowerBI Robots introduced many features Power BI users had been asking for years, like the ability to schedule and recurrently send reports by email, to a SharePoint library or display them on a large TV screen. Since then, Microsoft gradually added these features to Power BI in one way or another, but the way scheduling, report content or the slideshow are handled couldn’t be more different.
We broke down the main differences between Power BI’s email subscription service and PowerBI Robots in the following table, but keep reading for a deeper look at each of them:
| Microsoft Power BI |
PowerBI Robots |
| Sends a preview image of a report or dashboard and a link to access it on Power BI Online | Sends various reports as high-definition images, on a single PDF or multiple PDFs |
| Sends only 1 report page per subscription | Sends unlimited report pages per subscription |
| Sends reports to email addresses | Sends reports to email addresses, SharePoint folders, filesystems or to a URL |
| Sends reports to anyone in your organization | Sends reports to anyone, even if outside your organization |
| Sends reports once a day, once a day after data refresh, or once a week | Sends reports whenever you want, from once every 10 minutes to only once a year |
| Link to the reports don’t keep applied filters | Reports are sent with applied filters |
| Doesn’t allow any filtering customization | Sends different filtered reports to different users |
| No email body customization | Full email body customization |
| Slideshow mode with no data refresh | Slideshow mode with data refresh |
Scheduling:
Setting a recurrence for report delivery was the main driver behind PowerBI Robots’ development, as clients were begging for a method to update people who didn’t use Power BI but had to take a look at the data in the reports. PowerBI Robots recurrence can be set for a large variety of intervals, ranging from once every 10 minutes to once a year. Soon, it will support other forms of recurrence, such as specific days of the week.
This type of recurrence is already supported by Power BI’s scheduling system, but it severely limited to 3 options: once a day, once a day after data refresh and once a week. This means that if you need to inform someone more than once a day or only once a month, you can’t do it using Power BI alone.
Supported formats:
Email is the only delivery method supported by Power BI and sending reports by email is limited to users from your organization, as Power BI will prevent you from adding any “outsiders” to your subscription’s mailing list.
Email is by far the preferred delivery method among PowerBI Robots users, although the solution supports additional delivery methods that can make a difference in some organizations. Sending reports to a SharePoint or Filesystem folder comes in hand when you want to share information with a large pool of individuals, and soon you’ll be able to keep a record of these reports in the form of screenshots or PDF files, a new feature geared towards auditing scenarios. PowerBI Robots also allows companies to share reports and dashboards with emails outside their organization, one of the most common scenarios among its users, as covered in our SPAR and Olicargo case studies. The body of emails in PowerBI Robots is also fully customizable and includes tokens for the most common fields.
Content:
Content is where Power BI’s subscription service and Robots’ differ the most. When you send a report via email through Power BI, users receive a preview picture (PNG) accompanied by a link to navigate the report on Power BI Online. In contrast, PowerBI Robots sends reports as high-definition static pictures (either embedded or as attachments if you choose email as your delivery method) or single or multiple PDF files, not allowing users to access and navigate the full report on Power Online.
Power BI is severely limited to a single dashboard or report page per subscription, whereas PowerBI Robots works with a playlist method that supports as many report pages per subscription as you wish. This allows you to set up a single subscription with multiple report pages, the exact opposite of what you would have to do on Power BI – where you would need multiple subscriptions with single report pages to achieve the same effect.
Filtering:
Scheduling through Power BI doesn’t allow for any filtering since what you’re sharing is access to your whole report. By clicking the link and accessing the report on Power BI Online, users can apply any filters of their choice, so there’s no point doing it before setting up the scheduling.
Since PowerBI Robots’ purpose is wholly different – sending high-quality images of reports -, users are free to set up any filtering of their choice. Static images remove interaction and access to all information from reports, but sometimes that’s exactly what users may want. In the SPAR case we mentioned before, we had a chain of over 100 stores that shared a common Power BI central dataset. Because each had its own administration, reports had to be filtered to ensure they didn’t have access to data from other stores. PowerBI Robots allows you to apply different layers of filtering: at a global level, and individual filters per user, allowing you to send different data to different people, from the same report.

Slideshow:
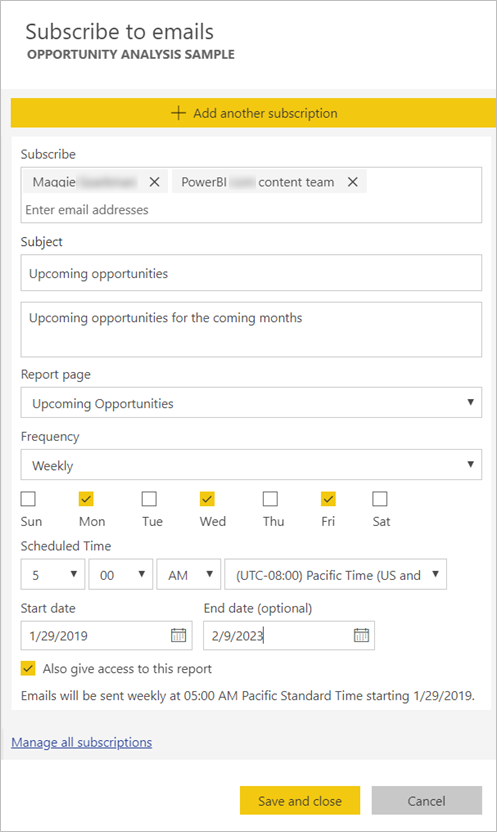
During March’s update, Microsoft introduced a slideshow feature in the Power BI Windows app, a feature that lets you present a report and rotate between its pages automatically, based on a pre-set frequency between 5 and 30 seconds. The slideshow is part of Power BI’s presentation mode, which is supported on any device running Windows, be it a Surface Hub, a desktop or a tablet.
PowerBI Robot’s slideshow feature works a bit differently, since it doesn’t run directly from Power BI, but the cloud. PowerBI Robots generates a unique URL for your playlist that you can paste on any browser to start a slideshow. The frequency between slides starts at 10 seconds and goes up to 5 minutes. Unlike Power BI’s slideshow, Robots doesn’t allow you to pause your presentation, but, on the other hand, it always displays a report’s most recent data, something Power BI alone doesn’t do.

If you have any questions or need help using PowerBI Robots, please check the product’s 101 guide or contact us by email.

Top 5 reasons your company should be at ESPC19
Disclaimer: the following blog post was originally published at the European SharePoint, Office 365 & Azure Conference blog.
For the third year in a row, DevScope will sponsor the European SharePoint, Office 365 & Azure Conference, this time in the beautiful city of Prague. Because you don’t sponsor an event for 3 consecutive years unless you really enjoy it and get something out of it, the ESPC organization asked us to share our perspective with everyone.
Here are the top 5 reasons we feel your company should attend the European SharePoint, Office 365 & Azure Conference 2019 based on our team’s experience.
We will have top speakers from all areas of the office 365 ecosystem
ESPC’s set of speakers is a mix of quality and diversity and features some of the most influential experts on SharePoint, Office 365 and Azure from around the world. Microsoft is obviously always well represented, from executives to MVPs and Regional Directors, but you’ll also have a chance to listen and see what partners from all over the globe have been cooking with SharePoint, Office 365 and Azure. Throughout the event’s four days, you’ll have the chance to attend over 100 sessions and interact with some of the best professionals in a plethora of areas that will surely cover your company’s specialties. The challenge here is picking which to attend.
You’ll have access to a diversified partner network
Being the largest SharePoint, Office 365 and Azure event in Europe, partners not only from the whole continent but from all over the world flock to the ESPC. Some will lecture technical sessions, others will demo their products and services at booths, but the vast majority is attending the ESPC to learn more and take the opportunity to have an “offline” opportunity with potential business partners. Interdependence is vital in IT, and a good partnership can help all involved companies pull what they’d never be able to accomplish alone. During last year’s edition, we had the chance to partner with Nestlé, Bosch, and Draeger, three companies doing amazing work in the digital transformation of their more “traditional” industries. If you’re attending, be sure to drop by our booth and share with us some of your challenges too.
International recognition of company brand and solutions
DevScope is a Microsoft Gold partner almost since its inception, and a well-known IT company in Portugal when it comes to SharePoint, Azure solutions and Power BI, but by international standards, we’re a small company, probably best known for our suite of products for Power BI and some healthcare industry awards. However, we never felt like a small company at the ESPC and were able to showcase our solutions to an audience just as large as larger companies next to our booth.
If Azure is one of your priorities, you’ll want to be at ESPC 2019
Azure’s growth has been astounding on all levels, so it’s not exactly surprising to see it reflected at the ESPC. Up until 2017, it wasn’t even a part of the ESPC, but last year, cloud-based applications and SaaS powered by Azure were probably the most popular partner offerings at the event’s booth section. DevScope was no exception to this, with our SmartDocumentor Expenses solution being our booth’s focus, with SharePoint-based intranet portals taking the second stage. We predict most of our intranet’s extensions and apps will run on top of Azure workloads and microservices.

Top-notch organization for both sponsors and attendees
From the registration to the booth set up and the event itself, the ESPC organization has worked flawlessly for us. When setting up our booth, we noticed we forgot to book a tv screen in advance and immediately panicked at the possibility of being unable to find one in such short notice. Thankfully, the organization was fully prepared for sloppy participants like us and handled the situation quickly. Finally, we need to mention the quality of the catering service. If you’ve had your fair share of technology events, you most likely noticed a trend when it comes to food quality. Fortunately, the ESPC is an exception and the food is just fantastic, as our Catarina Ricca, Product Owner, couldn’t help but notice in last year’s event highlights video.

We have achieved the Microsoft Gold Datacenter competency!
We are proud to announce we’ve upped our number of Microsoft Gold Competencies to a total of 6! DevScope is a Microsoft partner since its foundation and, year after year, we are committed to having our many areas of expertise fully acknowledged by Gold status. This year, the Gold Datacenter competency joins the previously earned Application Development, Cloud Productivity, Collaboration and Content, Application Integration and Data Analytics Gold competencies, for a total of 6.
We have also achieved Silver competencies in Cloud Platform, DevOps, Messaging, Small and Midmarket Cloud Solutions, and Cloud Business Applications. On top of that, we employ four Microsoft MVPs in our team, as well as the only regional director in the country, making DevScope one of the leading Microsoft partners in Portugal.
Attaining and renewing Gold status within the Microsoft Partner Network is a high priority for DevScope, meaning we are focused on achieving high-quality standards and keen to improve our ability to meet our clients’ needs and expectation, be it in consultancy and development services or delivering the best products in the market aimed at professionals.
If you wish to know how our competencies can help your business achieve better results, please contact us at info@devscope.net.

PowerBI SmartPivot 101: everything you need to get started
PowerBI SmartPivot is our first product for 2019, and we couldn’t be more excited about it. Much like the rest of our PowerBI Tiles family, PowerBI SmartPivot was born as an answer to our clients’ problems prior to being spun into a mass market product. In this case, our clients worked mainly in the retail sector and made extensive use of Excel PivotTables in their daily activity. Their woes included a high dependency on IT staff to connect databases to Excel, the lack of granularity provided by Excel alone and, perhaps most importantly, the time it took to filter their PivotTables when analyzing a wide range of items, a common occurrence in retail.
What is PowerBI SmartPivot and who is it for?
PowerBI SmartPivot is an Excel add-in aimed at professionals who regularly work with PivotTables. PowerBI SmartPivot introduces several features that make their life easier, namely the abilities to connect OLAP data cubes and Power BI to Excel, scan all data in an analytical model, apply filters in bulk instead individually ticking a PivotTable’s checkboxes and create granular table reports with ease.
Downloading and installing
An annual PowerBI SmartPivot license is available at DevScope’s store from 99.99€, but you can try it for free by downloading a full-featured 30-day trial version.
If you purchase a license during the product’s launch window, you can use code POWERBI-SMARTPIVOT-30 at checkout for a 30% discount.
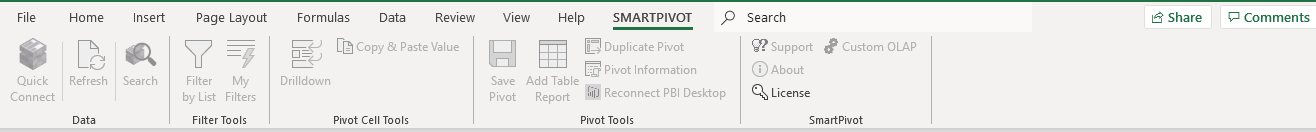
After downloading PowerBI SmartPivot, extract the file and double click it to run the installation wizard. Follow the steps and click finish. Open Excel and you should see a grayed out SMARTPIVOT tab.
 Click the License button and introduce the key emailed to the address you used to register for the PowerBI SmartPivot trial. Once validated, all options will become available.
 NOTE: if you don’t see the SMARTPIVOT tab in Excel, go to File > Options and click the Add-ins tab.
 From the Manage dropdown menu, select COM Add-ins and click the Go button. Make sure the DevScope PowerBI SmarPivot check-box is ticked and click OK.
The SMARTPIVOT tab should now be visible. If you still can’t see it, please email our support team.
Connecting OLAP cubes and Power BI to Excel
In order to connect a Power BI dataset to Excel, you must first open it in Power BI Desktop. Once you do, go to the SMARTPIVOT tab in Excel and click QuickConnect. You should see it in the list of connections available.

Double-click it and confirm the range. The PivotTable Fields will appear in the panel on the right. Select which fields you want to add to your PivotTable or drag them to the preset areas below.

Using the search function
PowerBI SmartPivot’s search function greatly expands on what Excel can do by itself, allowing users to find exactly what they’re looking for, regardless of the complexity of their analytical model.
To use it, select any cell in your PivotTable and click the search icon in the menu. A new pane will open next to the PivotTable Fields selection.

You can place any queries in the search field to find exactly the data you’re looking for. In the example below, we’ll ask PowerBI SmartPivot for the gross margin percentage (GM%) of transportation of Primus in 2014. PowerBI SmartPivot will instantly scan your data model and present you a list of the fields that best match your query.

Check the boxes from the list to add that data to a new PivotTable.
Filtering a PivotTable by a list of values
The more data you have in an analytical model, the harder it is to find exactly what you want. Even when you know where to look, it may take some time picking the values for your PivotTable because Excel only allows you to select or deselect all values at the same time.

This isn’t really a problem when you’re working with a small PivotTable, but individually picking which values to filter is a major annoyance when you’re working with hundreds or thousands of items. This annoyance became apparent to us when working with some of our retail clients. Their PivotTables often had hundreds or thousands of different products in them, which meant spending many minutes checking boxes one by one. Earlier last year, we launched Filter by List for Power BI itself on Microsoft’s AppSource for free and now integrated it in Excel with PowerBI SmartPivot.
Using it couldn’t be simpler. With at least a cell of your PivotTable selected, click the Filter by List icon from the menu to open the Pivot Filter pane. Write or paste a list of values you wish to filter your list by and click Apply Filter.

Your PivotTable will change and reflect those values.

NOTE: If your PivotTable has more than one hierarchy, make sure you select the correct one from the dropdown list.

If you plan on using the same filter recurrently, it’s a good idea to save it. To do so hit the Save Filter button after applying it. PowerBI SmartPivot will save the values in your filter and direct you to a Saved Filters pane, where you can apply, update or delete previously saved filters.
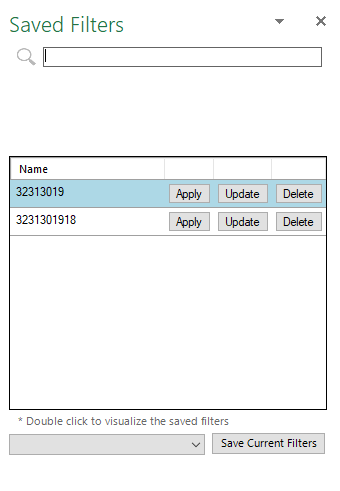
To access your saved filters, select any cell on the PivotTable and click the My Filters button from the menu to open a pane with the list of saved filters.

Creating a granular table from an OLAP cube
The final PowerBI SmartPivot feature we’ll cover in this guide is the ability to quickly create a granular table report by selecting its fields from a list. To do so, select a cell containing one of the results in your PivotTable and click Add Table Report from the menu. A window containing all possible fields will open.

To create a table, pick a field from the Available Fields and add it to the Selected Fields section.

When you’re done, click ok to create your table instantly in a new Excel sheet.

Thank you for your using PowerBI SmartPivot and making it through this (extensive) 101. PowerBI SmartPivot includes a few other features we won’t cover in this 101 because we feel are self-explanatory, but if you need any help using them, let us know.
If you still have any questions regarding PowerBI SmartPivot, please check the product’s FAQs or contact us by email.


Introducing PowerBI SmartPivot. Try it today for free!
We’re proud to announce PowerBI SmartPivot, a Microsoft Excel add-in that introduces several new features aimed at boosting the productivity of advanced PivotTable users.
PowerBI SmartPivot introduces a few features to answer the many woes we were seeing among PivotTable users, both in clients and within DevScope:
QuickConnect – instantly connect Excel to Power BI Desktop and Online, as well as Online Analytical Processing (OLAP) data cubes. All connections are saved automatically, so users only need to hit refresh the next time they open Excel to have their data at hand;
Search – find exactly what you want regardless of how complex your PivotTables are. PowerBI SmartPivot‘s search engine greatly expands what Excel can handle, allowing you to insert queries and instantly search all data content on an analytical model for an answer. All values found this way can be added to any location of your choice;
Filter by List – apply filter values to a report in bulk instead of individually checking each box in the filter pane, a feature previously only available to Power BI users. With PowerBI SmartPivot, all you need to do is paste a list of values in the slicer visual to filter by exactly what you wish. Filters can be saved and used later;
Table Reports – create highly detailed table reports using an easy to use search and pick method. Search for any fields in an analytical model and create a granular table report with them in just a few seconds;
Despite its name, you don’t need Power BI to use PowerBI SmartPivot, although the ability to connect the former to Excel is one of its main selling points. If PivotTables are part of your everyday life, we are sure PowerBI SmartPivot will make it much easier.
An annual license of PowerBI SmartPivot is available from 99.99€, but you can try it for 30 days for free without any limitations.
If you order PowerBI SmartPivot during its launch window, use the following code at checkout for a 30% discount:
POWERBI-SMARTPIVOT-30

PowerBI Robots version 2.1.11’s new features: here’s how to use them
PowerBI Robots just turned 1 year old, and we’re celebrating with a new version that introduces a couple of much-requested features:
- Add Cc and Bcc addresses when sending reports by email – let supervisors know which reports are being sent by PowerBI Robots;
- Edit filters in bulk using an Excel file – save time by downloading our template and editing filters in bulk using Excel;
To start using these new features, you must update your PowerBI Robots client to the latest 2.1.11 version. Click here to download it.
Add Cc and Bcc addresses when sending reports by email
If you need to keep managers or supervisions in the loop about any reports sent by email, you can add their email addresses to the newly introduced Cc and Bcc fields in the General tab after selecting Email in the Send to field.
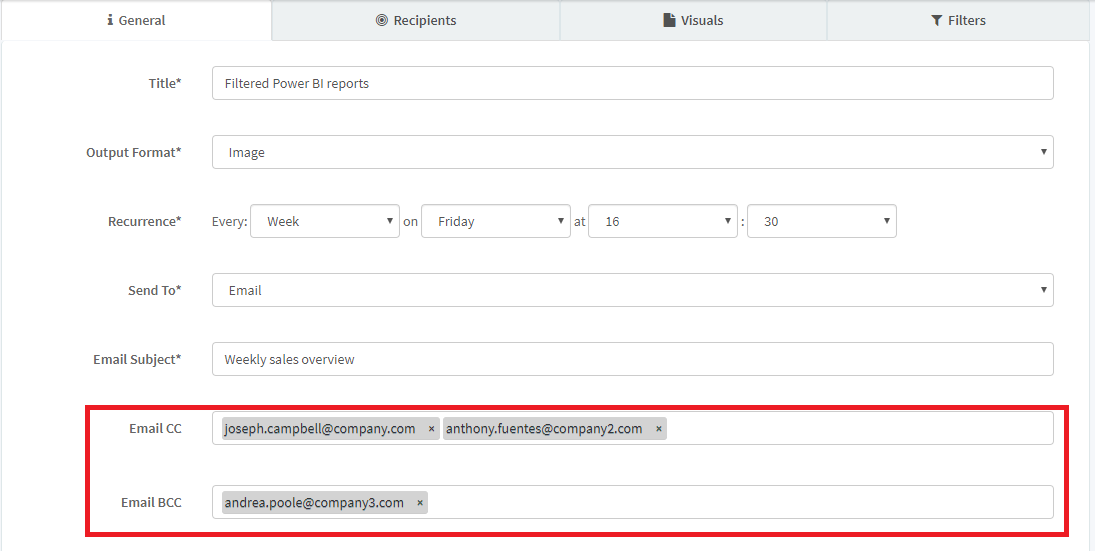
Whenever you send a report via email to any of your recipients, every address on the Cc and Bcc fields will also receive a copy in their inbox. If you apply different filters to different recipients of the same report, addresses on the Cc and Bcc fields will receive all filtered versions of that report.
Edit filters in bulk using an Excel file
The second feature introduced in version 2.1.11 allows users to save time by editing filters in bulk in an Excel file and uploading it to the PowerBI Robots web client. This feature was designed with experienced users in mind due to the risk of misediting important information, so be warned before venturing here.
To edit filters in bulk, go to the Filters tab and click Export Filters to download an Excel file named after your playlist.

After opening this file, you’ll notice four fully editable columns:
- PageName – write the path to any report page in this column. Page names are very specific, so we highly advise that you have at least one instance of the page you want to send and use copy/paste for new recipients;
- Recipient – add the email of any recipients to this column;
- ReportFilter – edit report-level filters in this column by changing any of the contained values;
- PageFilter – edit page-level filters in this column by changing any of the contained values;

After editing your Excel file, return to the Filters tab in PowerBI Robots’ online agent, and click the Import Filters button. Click Create or Update to finish.

If you still have any question, are running into some issues after installing PowerBI Robots version 2.1.11 or have some suggestions for future releases, please email us at support@devscope.net. Your feedback is greatly appreciated.

Workaround for PowerBI Robots and Power BI’s printing issue
For the past two weeks, Power BI has been undergoing some adjustments that have created an issue affecting its export to PDF and print functions, as well as our solution PowerBI Robots.
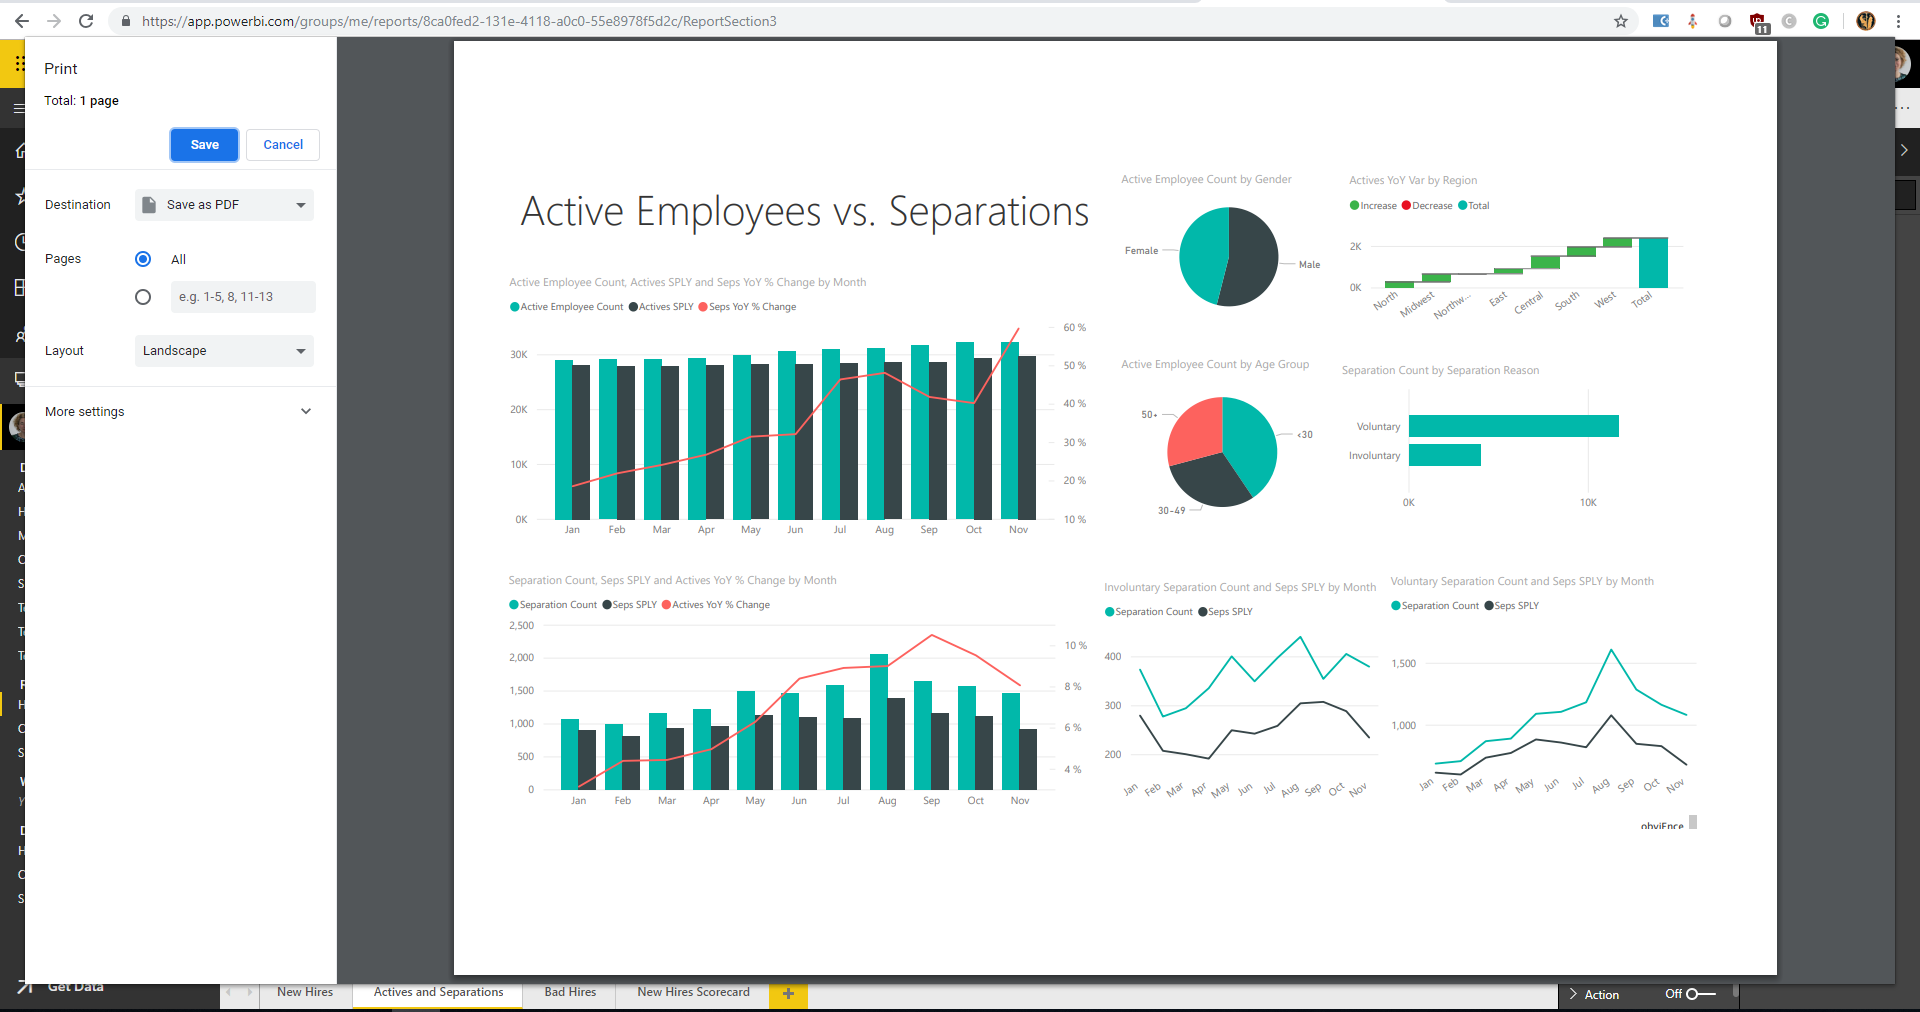
The result is a cut off in a report’s upper left corner when printing or sending it via PowerBI Robots, as displayed below:


Several users have contacted us regarding the issue and written numerous posts on the official Power BI forums, as well as others since this also affects Power BI’s native print and export to PDF functions.
We’ve been in contact with Microsoft since we first encountered this issue and have confirmation that it will be fixed in all regions by Friday, April 5th.
Until it’s fixed, we have a workaround that you can find below:
- Open Power BI and select the reports that appear cut-off in the “Print PDF” option and/or in PowerBI Robots;
- Click “Edit Report” and select the “Shapes” in the top toolbar;
- Insert a rectangle around the whole visual;

- In the “Format Shape” right-hand panel, set “Line” and “Fill” to 100% transparency (the rectangle will be invisible, therefore not affecting or changing the existing visual);

- To test this solution, use the “Print” option and validate if the visual appears correctly in the page preview;

DevScope’s team truly apologizes for any inconvenience this may have been causing to the daily functioning of your company.
If you still have any issues with PowerBI Robots, please send us an email to support@devscope.net.

Meet us at the MVP Global Summit 2019!
Once a year, Microsoft awards the title of Most Valuable Professional (MVP) to about 4,000 technology experts across 90 countries/regions who actively engage and share their knowledge with the community. MVPs have a deep knowledge of Microsoft products and services, but also the ability to use them to solve real-world problems. Above all, they are professionals who are always willing to help others.
Microsoft recognizes their effort and contribution by allowing them to try beforehand brand new, advanced technology but also by flying them to an annual MVP Global Summit. Besides featuring a large catalog of in-depth technical discussions and feedback sessions, the MVP Global Summit also presents networking opportunities among MVPs and Microsoft product groups.
DevScope is probably the company with the most MVPs in Portugal and, between March 17 and March 22, five of our staff won’t be at the office but instead trying new tech and enjoying themselves at Bellevue and Redmond, namely:
- João Sousa, Visual Studio and Development Technologies MVP
- Rui Romano, Data Platform MVP
- Sandro Pereira, Microsoft Azure MVP
- Pedro Sousa, Microsoft Azure MVP
- José António Silva, Microsoft Regional Director
This is DevScope‘s highest number of professionals at the MVP Global Summit, and we’re very proud of their commitment to the Microsoft community. If you’re among those attending and meet one of our MVPs, say hello. We’re sure they’ll be delighted to exchange a few words and talk about opportunities to collaborate.
